Anatomy of an Earnings Play
One of the most interesting and challenging trades with options is an earnings play. The main reason is the huge amount of uncertainty that surrounds the stock before an after the numbers are released. For that reason option dealers start to overprice massively the cost of options so they can offload a big chunk of risk into unsuspecting option buyers. This overpricing is such that even if the trader gets all the parameters of the thesis correct it is very likely that he/she will lose money on the trade because of the collapse in implied volatility that happens the next day.
An example with TSLA earnings for October 24/ 2018
Case in point is Tesla, which is a stock that is very volatile during normal times and can become right down crazy around earnings announcements. For the Oct 24 2018 earnings calls it was even crazier as the company decided to move forward the announced (it was scheduled for several weeks later) and there was massive speculation about the reasons why. Because of this option dealers were pricing the Oct 26 options as if TSLA will move at least 13.5% up or down after the releases (which suffice to say is a massive implied move). In other words options were incredible expensive the afternoon of Oct 24. I decided to take advantage of this overpricing because in the past TSLA had moved about 6.5% after earnings releases and also because of the expected volatility collapse the next day was massive for Oct 26 options (about 90 vols of drop). Given my bullish stance and the expected volatility collapse the best trade was a binary risk reversal.
Binary Risk Reversal
The idea behind this kind of trade is to have a directional exposure to the stock and at the same time to take advantage of the volatility collapse the next day. The basic trade is this one:
- Sell downside binary TSLA Put for Oct 26.
- Buy upside binary TSLA Call for Oct 26.
Given that the market for single stock binary options is non existent in the US the trade was replicated as follows:
BUY 1 TSLA Oct26 270 PUT / SELL 1 TSLA Oct26 272.5 PUT / BUY 1 TSLA Oct26 322.5 CALL / SELL 1 TSLA Oct26 325 CALL
If you pay close attention to the trade you will notice that it consist of a short vertical put spread and a long call spread in a single trade.
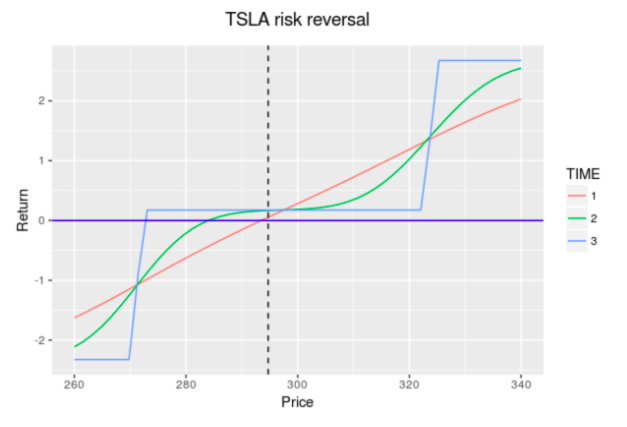
The cost of the trade was actually a credit of $0.34 per contract (got paid to enter), but of course the trade requires a net collateral of $2.16 (which is the max risk). Here is a simulated profit and loss profit for the position:

As you can see the trade works in several regions, if TSLA ends below 270 we have a max loss of $2.16, between 272.5 and 322.5 we get to keep the credit received of $0.34 and if it moves above 325 then we get the max gain of $2.84. Not a bad trade at all.
As it happened at the close that day reported very good earnings, and it opened the next day around 319 (before starting to drop during the day). At the open I managed to close to the trade at 0.81 credit, so in essence I got paid to enter and got paid to exit for a net profit of $1.15 which is a return of 47% over max risk. Not a bad day at the office at all.
Source of the Edge for the Trade
The trade worked because the thesis was fulfilled. TSLA moved substantially high the next day and volatility collapsed really hard as well and that precisely was the main source of the edge. The short put spread in the position lost huge amounts of value (therefore providing a fat profit) due to vol collapse and the upside nove. While at the same time the upside call spread remained stable bringing a net profit on the whole trade. And that was the key to this particular position, the fact that option dealers overpriced options so much the day before allowed us to enter into this trade with a nice statistical edge.